


Impact So Far
Since launching this effort back in late April, I’m able to visualize progress since then. Some of you may remember that a couple of years ago, I made a post on LinkedIn on how it was cool to see page views and events on my website using Google Analytics. Through this tool, I visualized where website visitors were coming from.
Here’s an update based on what I’ve been seeing so far in my Google Analytics.
Metrics as of 5/11/2025
Overall Picture - Last 12 months
Here are the metrics for my website for the last 12 months. In the bottom-right corner, you can see a detail view on an anomaly detected in 27 Apr - 03 May of this year. That was when I reposted my recent blog across social media platforms! I posted on LinkedIn and Facebook.
I did not post on Instagram or TikTok, as I pondered on building a more intricate video where I do a walkthrough of my personal site and voiceover. I haven’t done a video like this, so I’ve been holding off. But - looking to work with folks to get this done!!
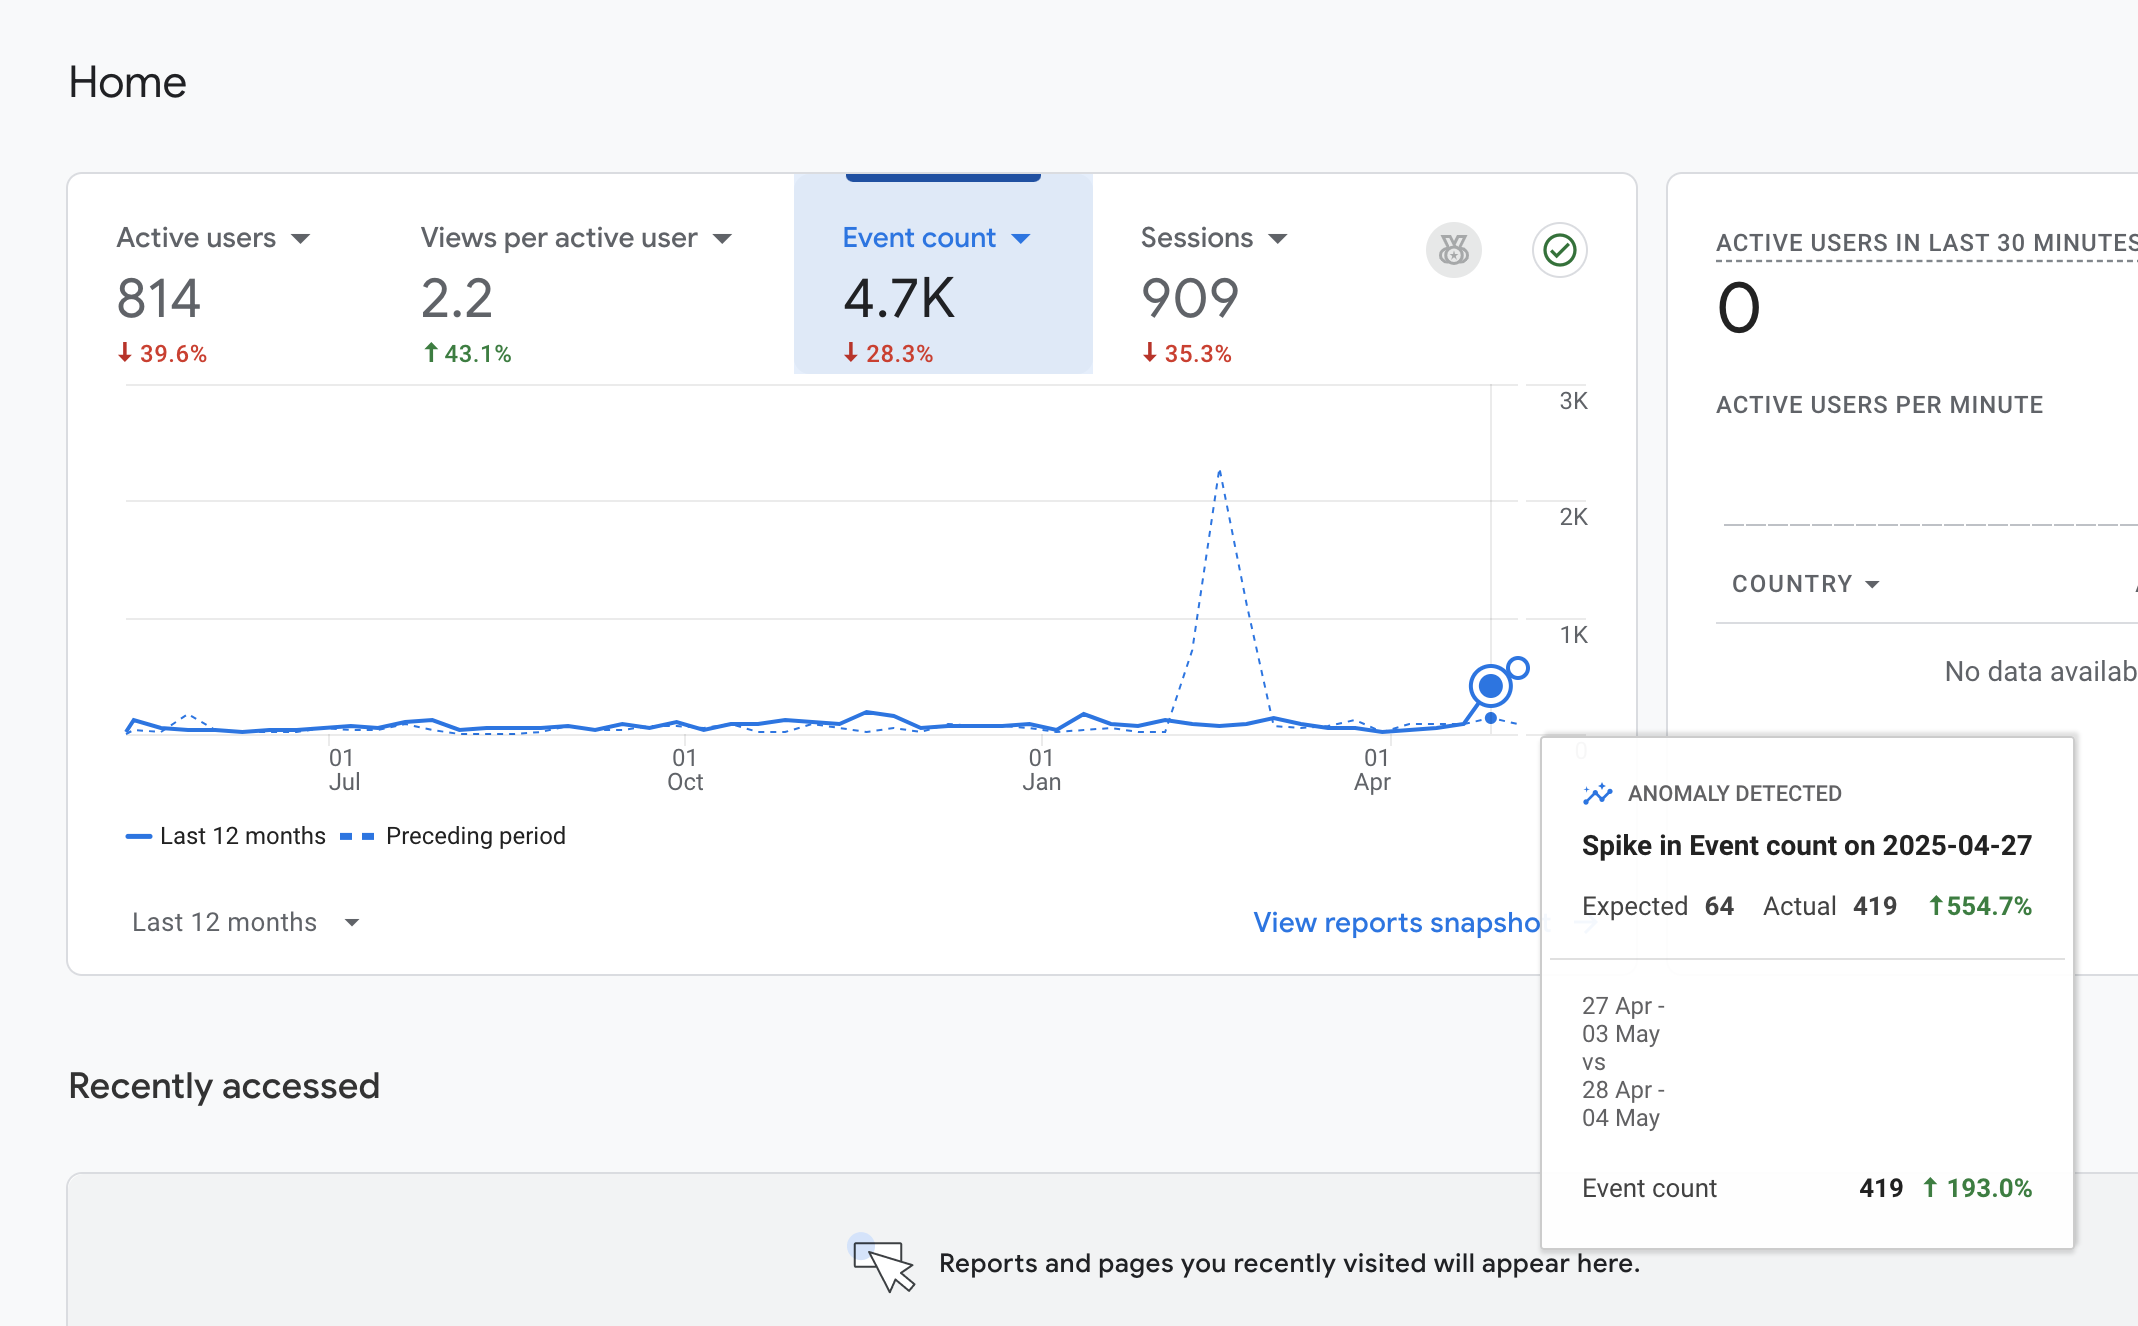
Btw, I believe the y-axis on this graph is mislabeled. When I hover over that preceding spike between Jan and Apr, it actually shows as “16 active users”. I’ll dig deeper in another screenshot.
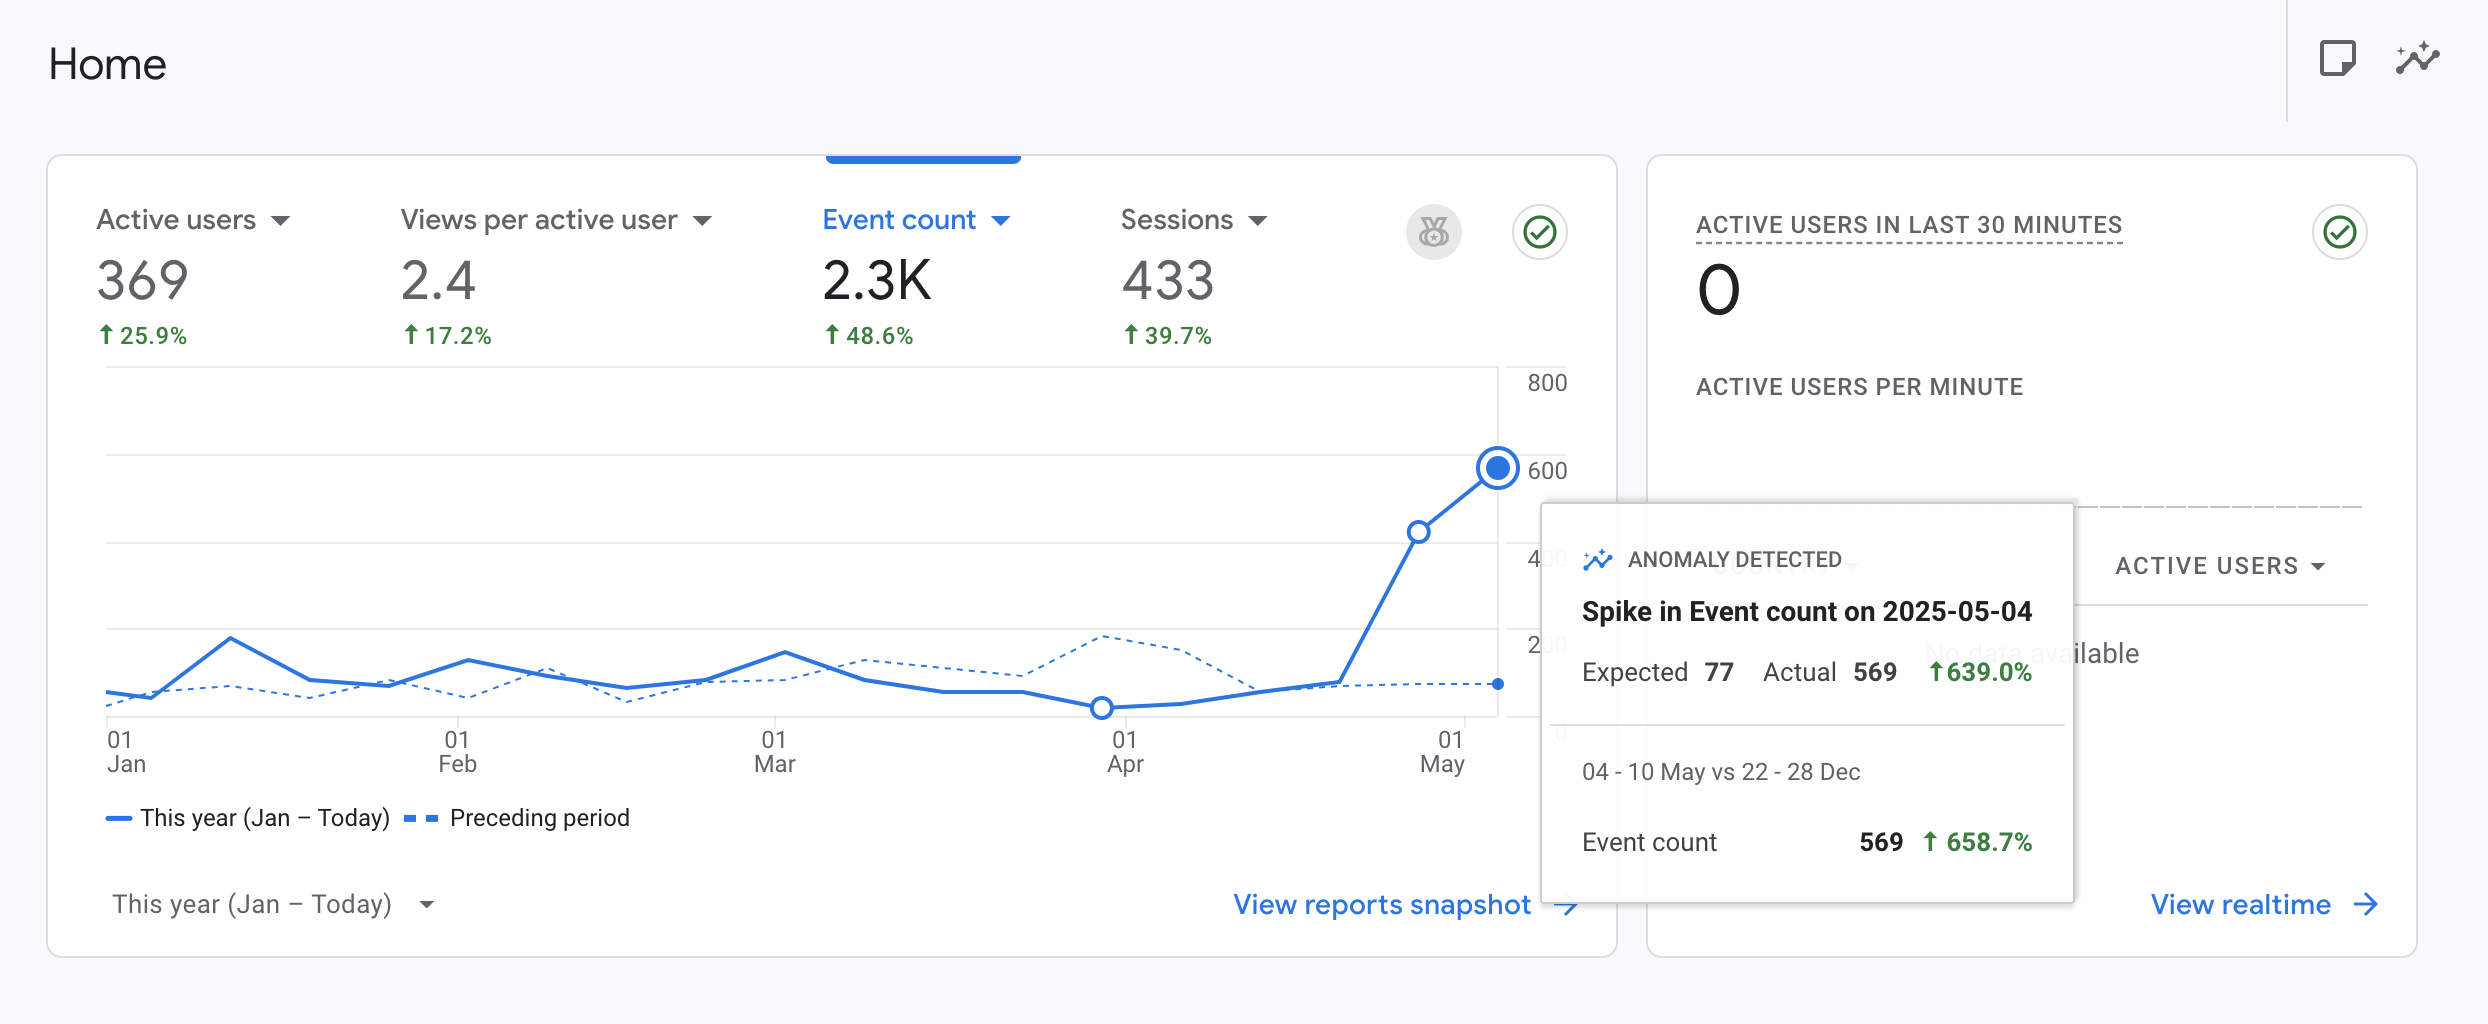
2025: Increase of 639%
Looks like my recent more detailed blog post was a smashing success - over 500 events on my site total! Not gonna lie this is pretty cool and motivating lol. 🥳 🍾
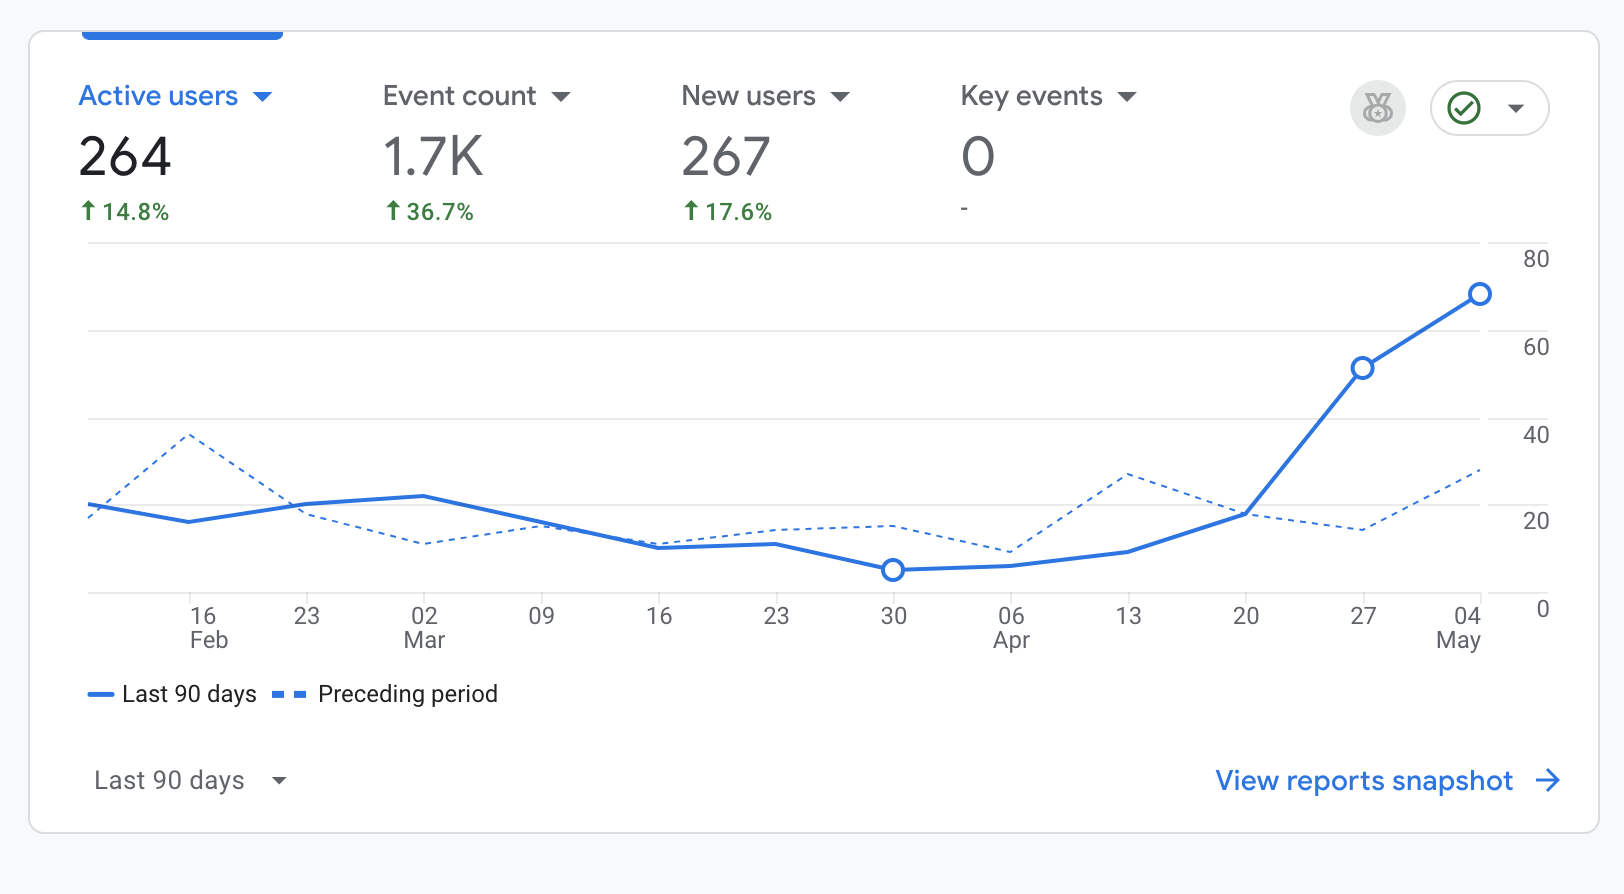
Recent Changes
Woah! That’s crazy. Looks like there have been 1.7K events on my website. When I saw this back a couple years ago when I first set it up, it was at about 100-something. This is super cool to see after checking back in this week.
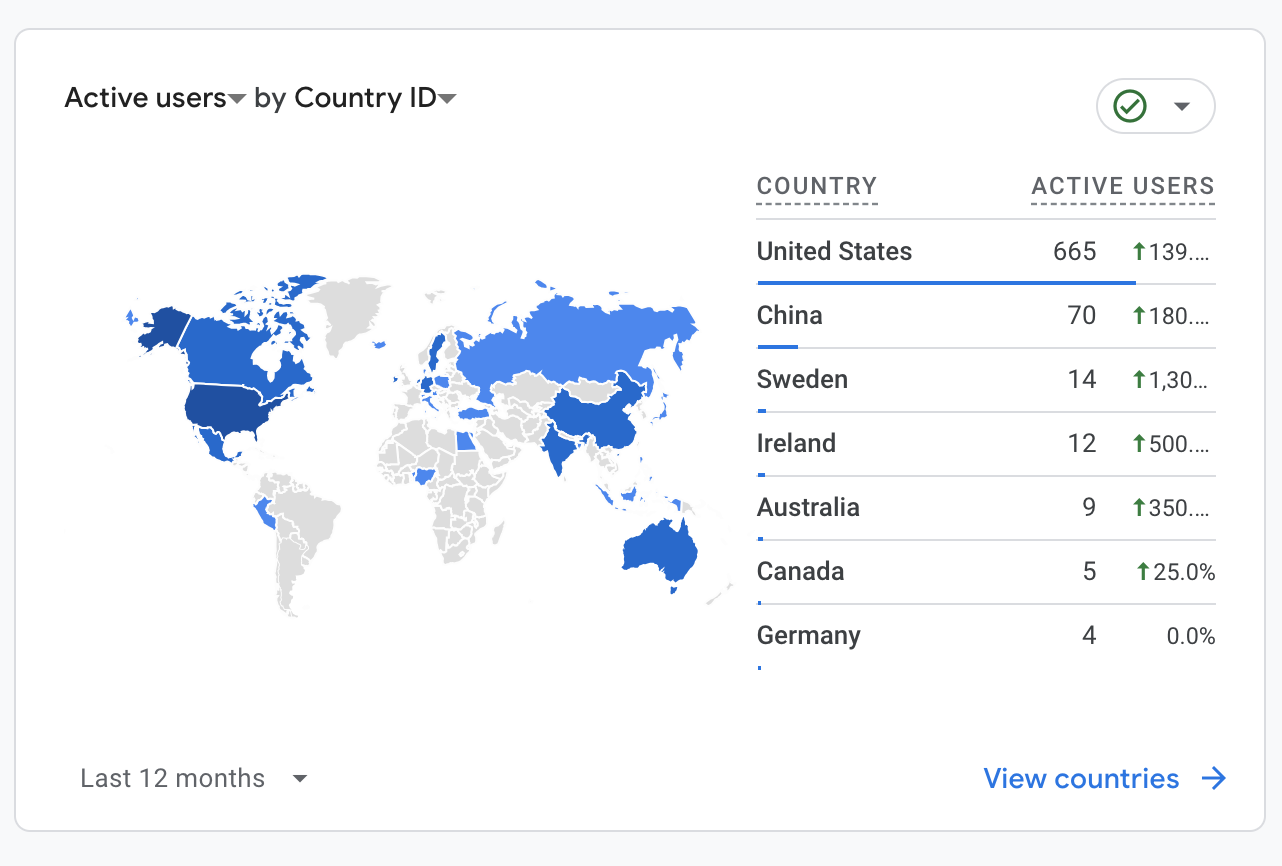
Active Users by Country Over the Last 12 Months
Here’s a screenshot of users across countries. Wild. And it’ll surely only grow from here!
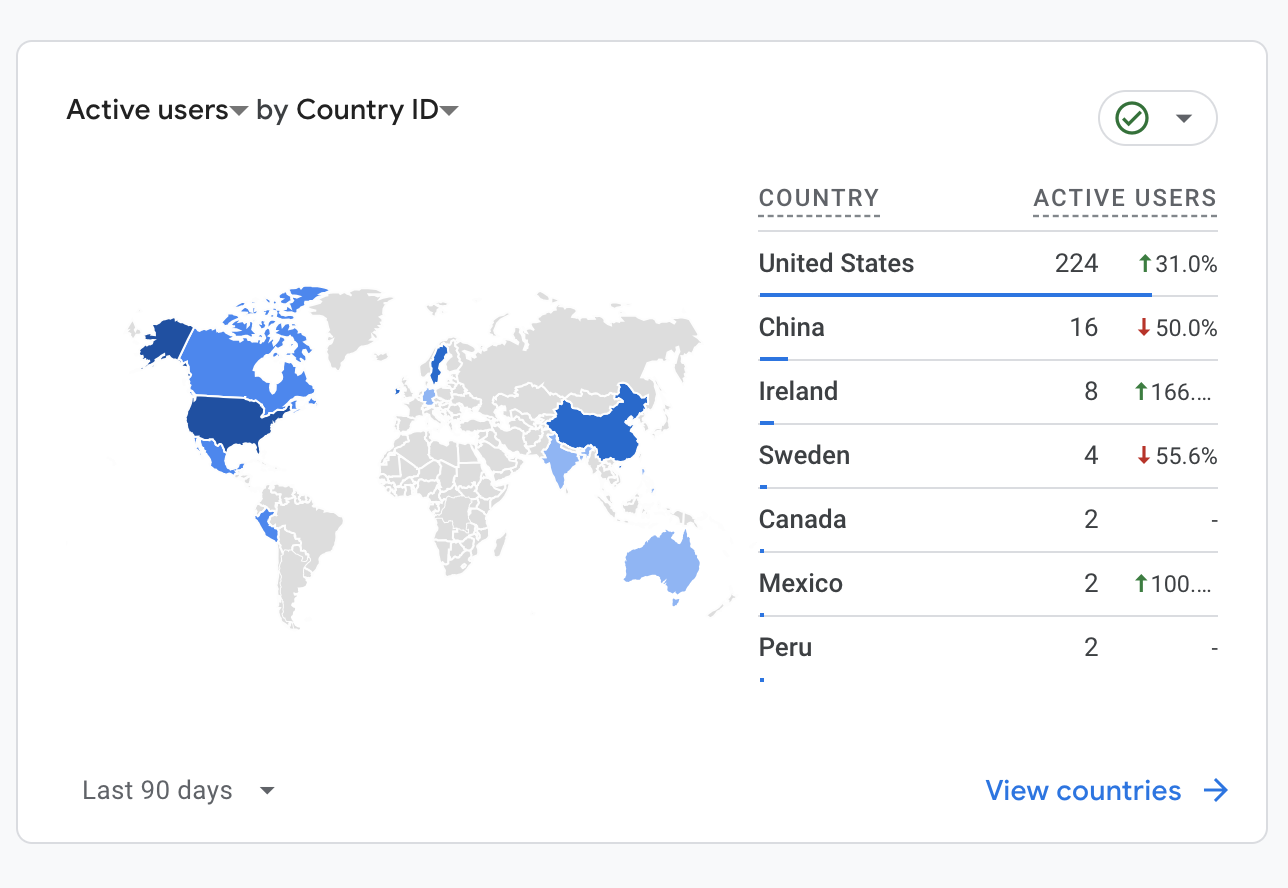
Active Users by Country Over the Last 90 Days
Also cool to see changes in the last 90 days. Hello Ireland, Canada, Mexico, and Peru! Bye China and Sweden lol.
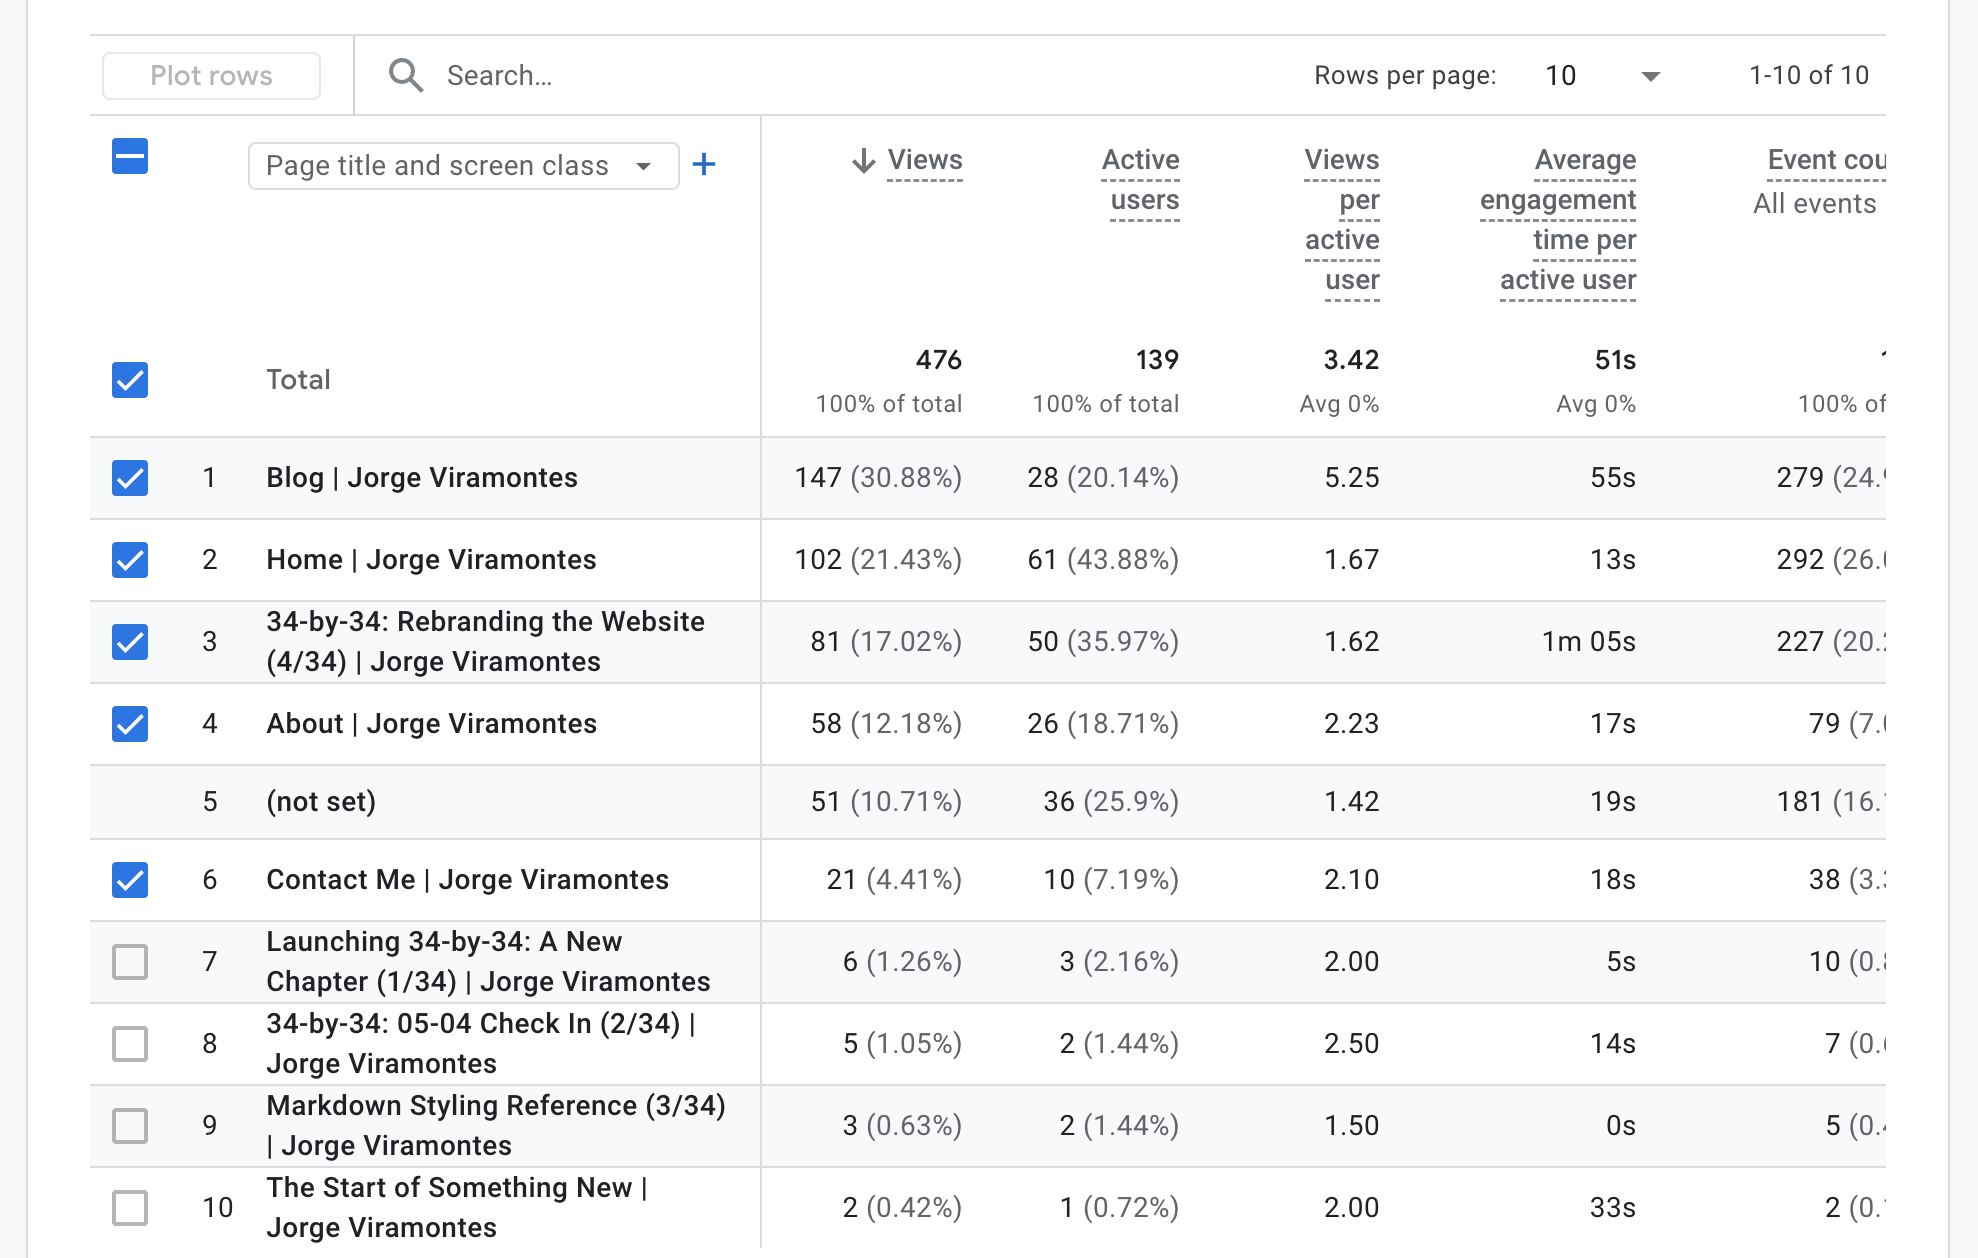
Page Views
Alright, so here are some of the metrics for this website over the last several days. It’s actually super cool to see that numbers are really going up! This is just the proof of consistency… set up systems that help you out. Then, the returns on your investment will start to show over time.
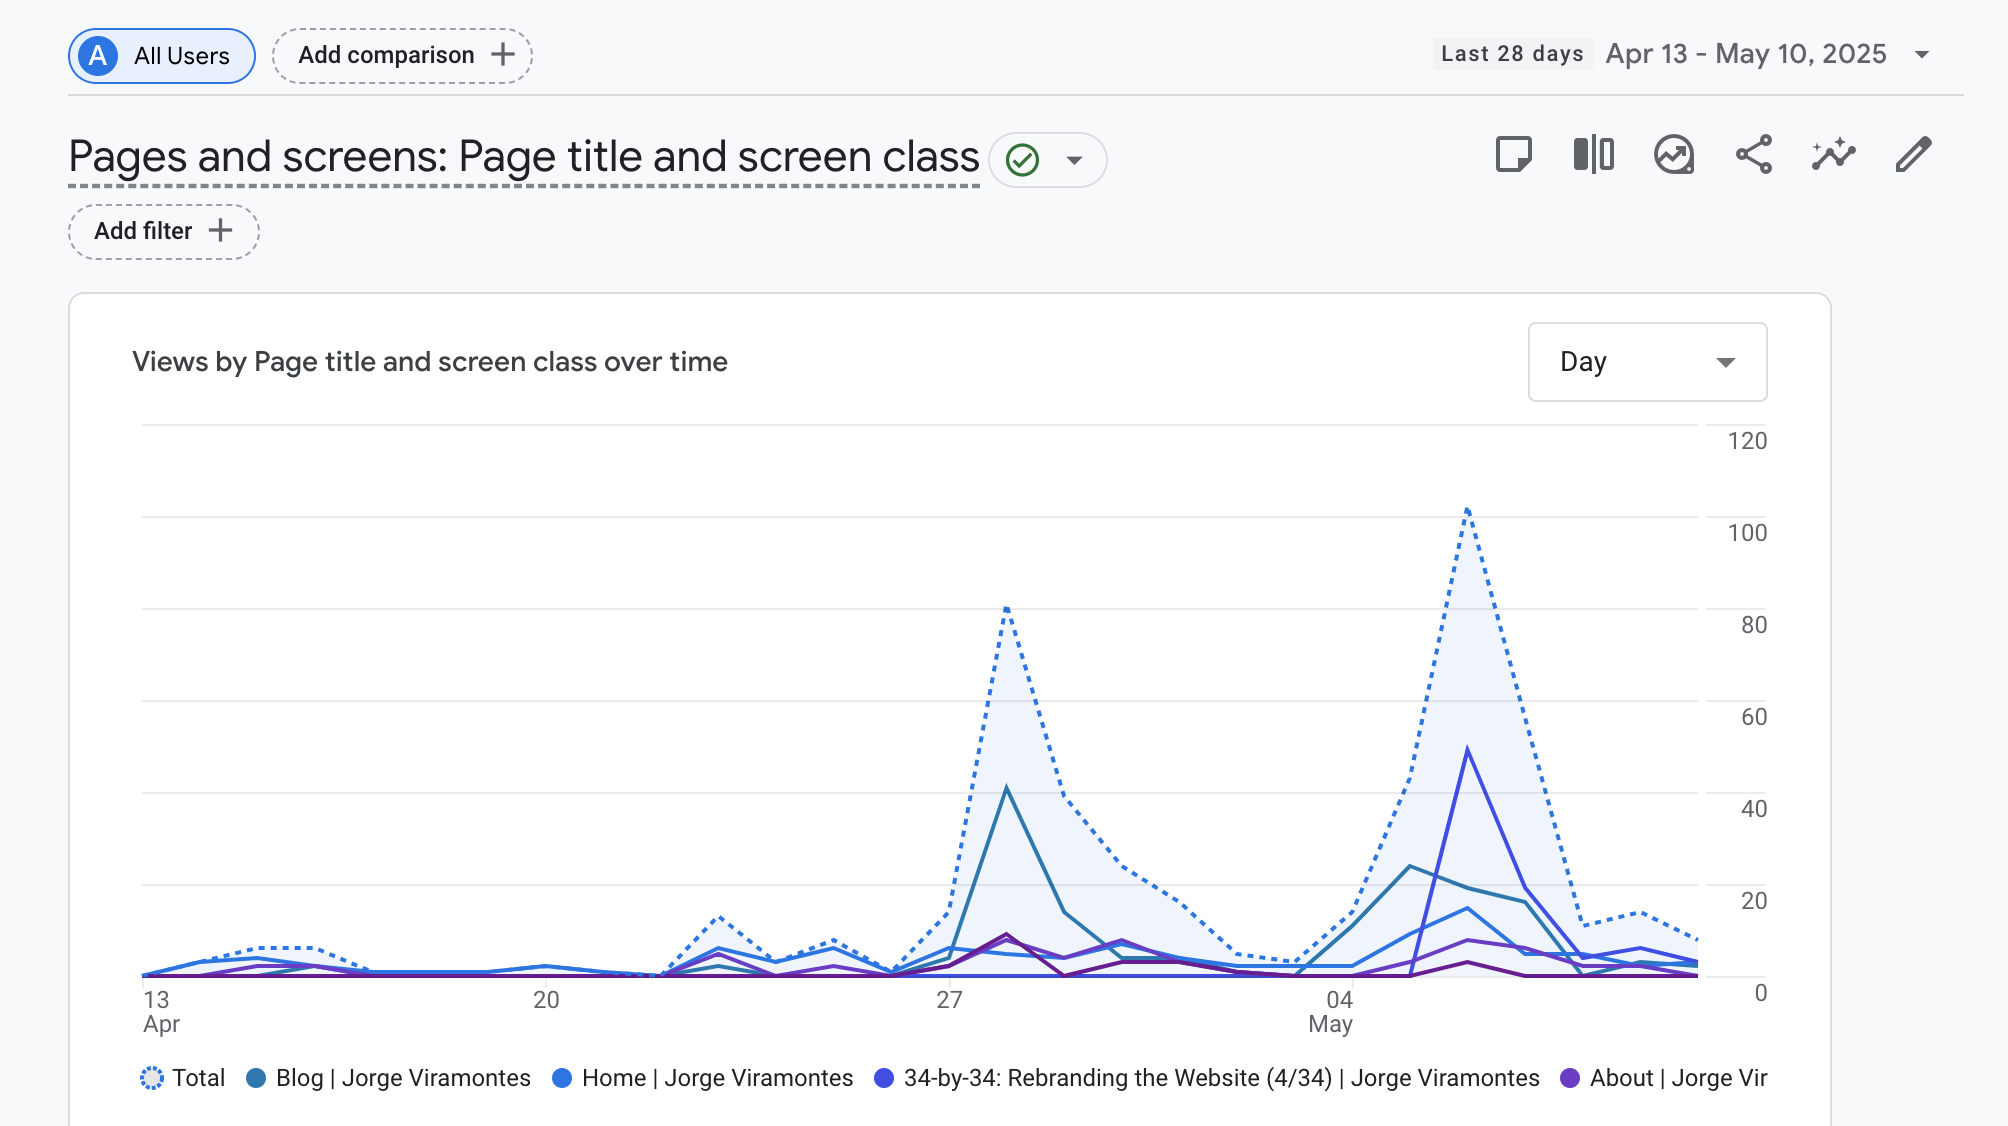
81 Views on the Rebrand Blog
I hadn’t really done anything special while uploading these recent 34-by-34 blog posts. But looks like analytics are already showing up here. And good news: blog page views are being tracked!
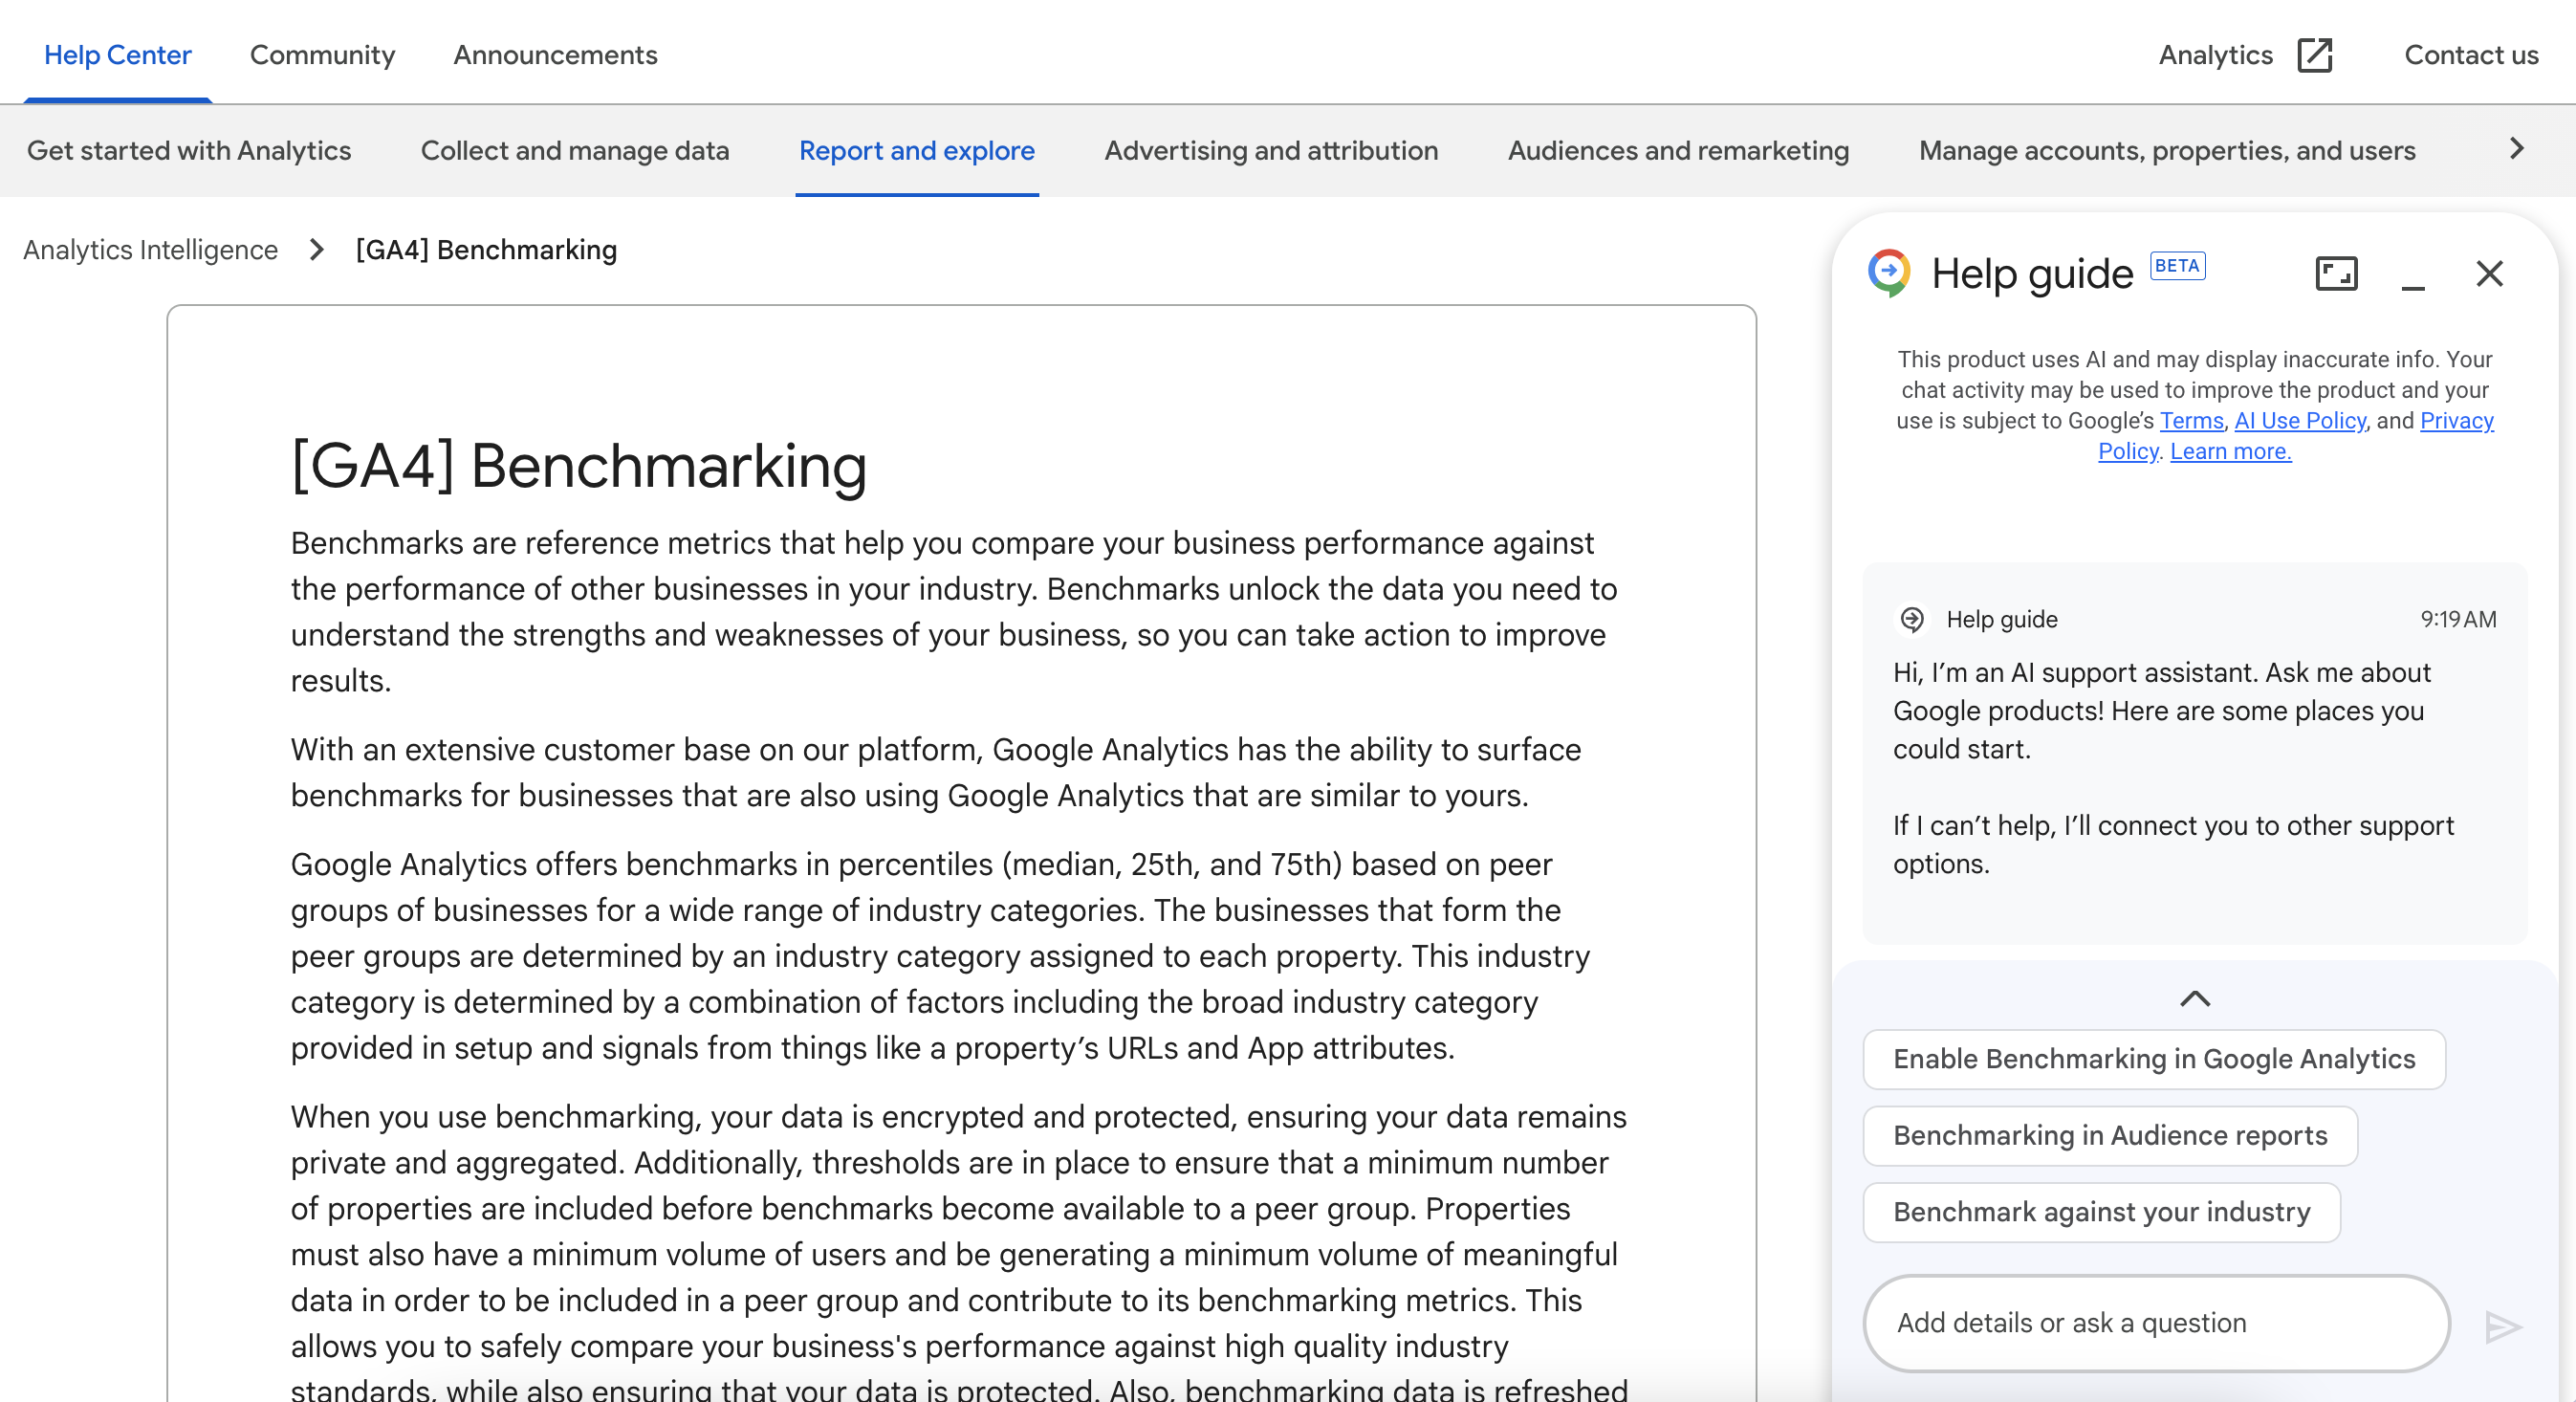
AI Integration
In 2025, AI has been incorporated into Google Analytics. This wasn’t there before when I set this up around 2022. On the Google Analytics Dashboard, there's a Help guide, which is an AI support assistant. Tools like these can help decipher concepts that might've taken more work in the past to understand. Cool use of AI to gain efficiency!
It’s been a common experience to see companies/organizations integrate AI assistants into their native platforms. Overtime, it’ll be interesting to see which tools are gaining traction with folks (Notion, ChatGPT, Claude, Google Gemini, Stripe Docs, Google Analytics).
Conclusion
It's pretty cool to see the progress made over time.
When starting something from scratch, it's always a bit intimidating.
When founders start a new business idea, it's always a huge milestone once you reach that first paying customer. Starting something online and sustaining engagement is no different.
The key is to continue to produce.
In 2025, much of our online engagement, for better or for worse, is on popular social media platforms such as Instagram and TikTok.
My intention with this project is to continue building my personal brand, doing something that's fun, and building a creative outlet that allows readers into my brain's creative process. As always, thanks a lot for checking it out!